
Last updated: 19 October 2026, 2:01 PM
Early voting in Georgia began on October 13 and will continue until October 30. Election Day is on November 3. Here, I will post some statistics and visualizations that I am using to help monitor turnout as Election Day approaches.
Time till polls close
As of now, the Secretary of State’s office counts 8,233,259 registered voters in the state, of which 703,517 are classified as “inactive”. This means they have not interacted with their county election’s office in more than five years, although they still have the right to vote. That leaves us with 7,529,742 active voters. So far, 929,557 have voted, primarily by voting early. That figure also counts absentee ballots returned to the election office. It is possible we could reach 1 million voters by the end of the day.
Source: https://sos.ga.gov/election-data-hub
As of right now, about 51.41% of voters are White, and about 34.51% are Black. Both figures are slightly above their respective proportion of registered voters. Black voters in particular are currently exceeding their proportion of registered voters by 3.5 percentage points, which is a good sign for Democrats. The figure is also likely an undercount, as many voters don’t have their racial data entered in to the system (hence the Other/Unknown) category.
The median age of early voters so far is extremely high. It was 63 on Tuesday, the first day of early voting, and hovered around the early 60s until the weekend. Weekday voting can be very inconvenient for working families, so it isn’t a surprise that retirees dominated the first days. Over the weekend, the median age dropped nearly ten years to 54 (Saturday) and 53 (Sunday). The median age of a registered voter is 45.
More people voted every day this week than the respective day four years ago. Only about half of this can be explained by population growth. The other half is genuinely an increase in early voting.
Drawing conclusions
It is tempting to see the huge spike in early voting (nearly 40% increase so far) as a sign of significant support for Democrats. It’s possible that’s true, but I point out two things. First, we are seeing a huge decrease in absentee voting, and it is possible that many Democrats are switching to early voting due to concerns over the Trump administration’s attacks on mail-in voting. In 2022, about 285,621 absentee ballots were sent out. So far, only 143,000 have been requested. I project that number to grow to around 157.8k by the deadline (October 23), but that would still represent less than half the number of absentee ballots cast in 2022.
If high early voting trends continue, I will be more confident in saying that they point to a Democratic victory. The reality is that we don’t know how the early voters have voted, and using racial, gender, and age data to guess is risky because we don’t understand the trends well.
I will note that I use 2022 as a benchmark for turnout instead of 2024, which a lot of other observers are doing. Turnout in midterm years is usually markedly lower, so it’s statistically more sound.
Reference points
Here I am going to include some additional data I am using to study the electorate, that isn’t necessarily related to early voting but might be helpful in understanding demographics.
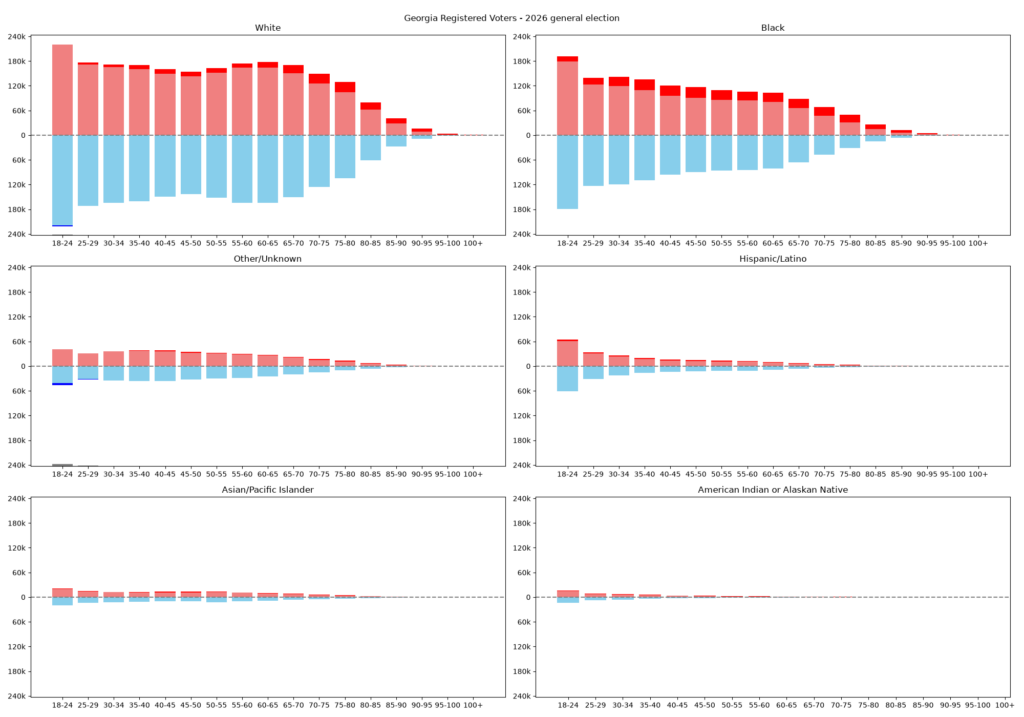
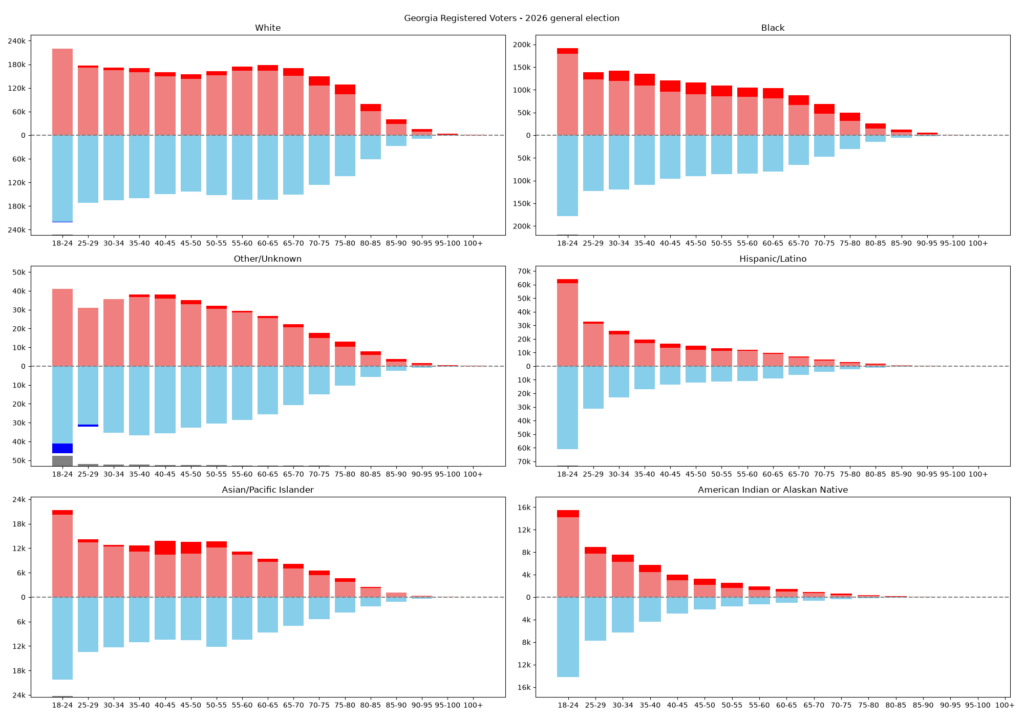
For the following population pyramids, women are on top and men are on the bottom. Voters of other genders can be (barely) seen on the bottom of each pyramid. For the registered voters graphic below, the darker pink/blue shading represents the excess of women/men over the other for that age group.
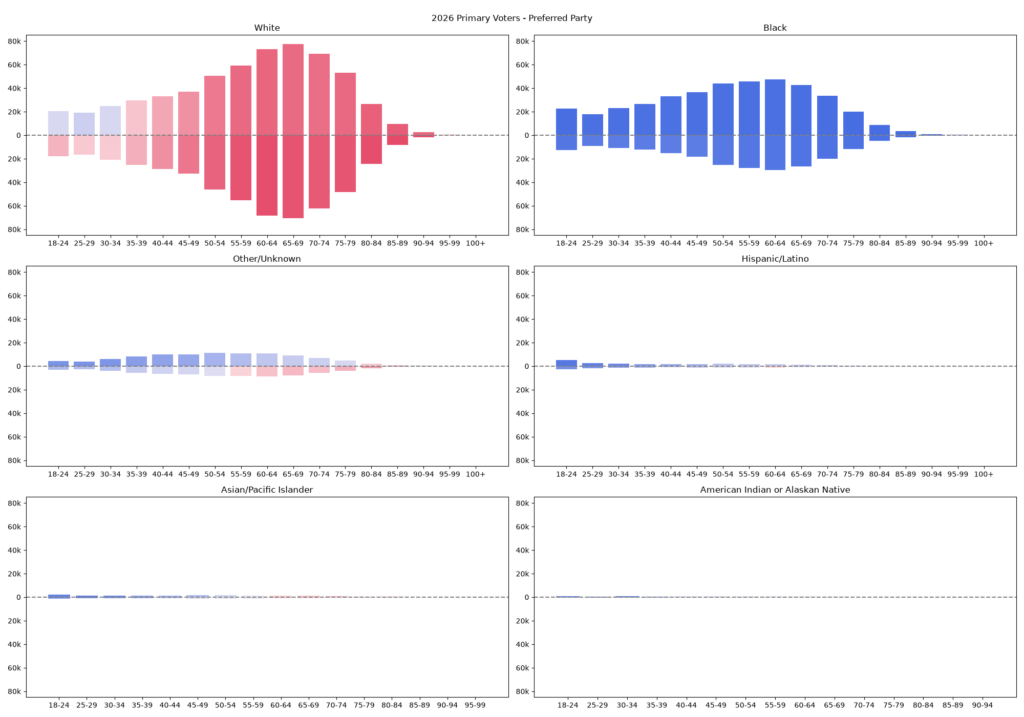
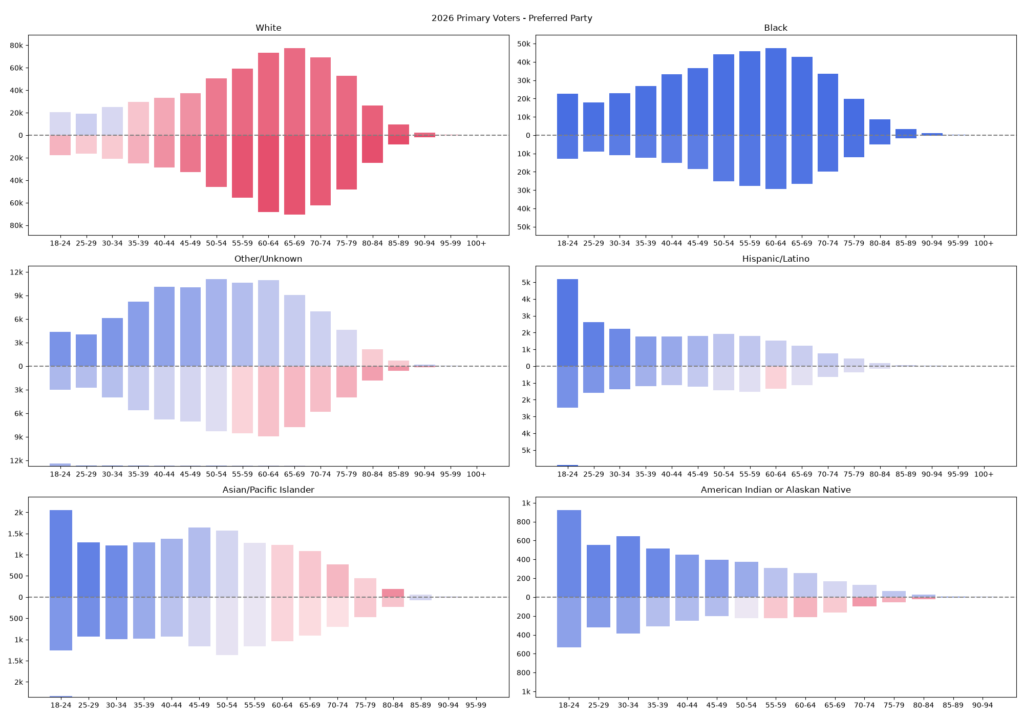
Now lets look at primary data. Below, we can see each demographic shaded by the most popular party ballot in the primary. This isn’t necessarily a reflection of general election behavior, particularly with respect to turnout. Some demographics may be more interested in primaries than others.
If you’re interested in seeing how I made these graphics, I have uploaded the Python source code to GitHub.