
I plan to use several models to analyze and forecast the results on election night. I am still working on getting everything uploaded to this site, but for now I will include a “short” description of my plans below.
Polls close in
Introduction
The Regional Swing Model (RSM) uses early-reporting counties to calculate the partisan shift between two elections. Early reporting counties tend to be rural, sparsely populated counties. This is why Republicans usually take an early lead in the count, known as the “red mirage.”
For example, if the first three counties to report show that the Democratic candidate is over performing the previous Democrat’s result by 5%, we can project this swing onto the rest of the results and get a sense of where the candidate’s vote share will end up. As more counties report, the prediction gets more accurate, because it incorporates more and more of the actual results. The swing in Georgia elections is usually pretty uniform across the state, but we can account for regional differences by breaking the state into several regions. Once we get enough votes in from each region, we will be able to tell with certainty what the final outcome will be. We also use the counties with finalized returns to predict the change in turnout in unreported regions, making our model more precise.
There are 11 regions total, 6 of which are in the Atlanta metro area and 5 outside of the metro area. They are designed specifically for this purpose.
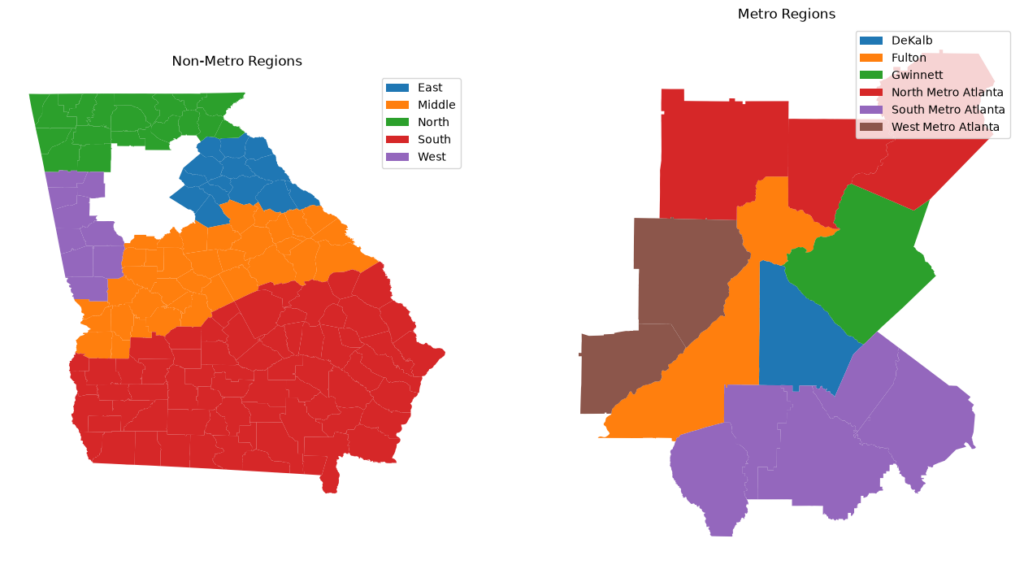
Experiments with previous election results, including those of the 2022 midterms and the 2025 special Public Service Commission elections demonstrates that the regional swing model can predict the outcome of most elections with only 10% of the vote reporting, with a margin of error of less than 1%. However, this margin depends on the uniformity of the swing, and which counties are included. Because of the segmentation of the model, it is REALLY hard to get a straightforward margin of error. Once we get enough results in, we will be able to tell from the uniformity of the swing whether the projection is likely to hold. For example, if virtually all reporting counties are showing a 5% swing in favor of Democrats, and only a 4% swing is necessary, we can conclude that it is highly improbable that the remaining counties will produce a swing low enough to deny the Democrats a victory. If there is a very good reason to suspect that the unreported areas will do something peculiar (e.g. local dynamics may be less favorable to Democratic gains), we can hold off for longer.
Swings
Firstly, my notion of “swing” is a measure of change between one party’s share of the vote between two elections. It is not, as is sometimes expressed, a comparison between the relative performances of two parties. In my data, the expression “a 5% swing in favor of Democrats” means the Democratic candidate outperforming the previous nominee by 5%.” It does not (necessarily) mean that the margin between Democrats and Republicans is 5% less than it was last time; that is the “two-party swing”. The reason I use a one-party measure is that I need to be more precise. Georgia’s runoff rule sets the threshold for victory at 50% of the votes plus one, not simply a relative majority. For the governor’s race, Keisha Lance Bottoms must obtain at least a 4.12% swing in favor of Democrats to win; that would take her from Stacey Abrams’s 2022 performance of 45.88% of the vote to 50%.
I will use two-party swings on occasion, but I will always indicate when I do so. The abbreviation “TPS” stands for “Two-party swing”. It is calculated by taking the swing for Republicans and subtracting the swing in favor of Democrats, and dividing in half. For example a 6% swing in favor of Republicans and a 3% swing against Democrats: (6% – -3%) / 2 = 4.5%. A positive result indicates a swing for Republicans, while a negative result indicates a swing towards Democrats.
Benchmark races
Many analysts are using Kamala Harris’s 2024 performance as the benchmark for Democrats across the ballot, expressing the necessary Democratic gains in terms of an overperformance or underperformance of Harris. There are benefits to this, as the 2024 election was more recent than the 2022 election, and thus reflects a different sentiment to the state compared to the 2022 election. However, I have instead opted to use the data from whenever the particular race was last contested; i.e. 2022 gubernatorial for 2026 gubernatorial, 2021 Senate runoff to 2026 Senate election. The primary reason is that using race-specific data more accurately reflects the dynamics of each individual race, which matters a lot for down-ballot races.
Expectations for election night
Polls close at 7:00 PM Eastern Time on Tuesday, November 3rd. Legally, results cannot be released to the public before then. Some counties will tabulate early and absentee votes on election day before the polls close, but we won’t get them before 7. The speed of a county’s returns depends on the competency of the county elections infrastructure, combined with the scale of the electorate. Well-run rural counties may be fully reported by 7:30 PM. Counties with larger populations such as Fulton have to contend with a larger administrative burden. The first metro Atlanta results during the primaries did not come in until at least an hour after the first rural results.
By law, all superior courts must hold session until at least 9:00 PM on election night, and after that at their discretion, for the purpose of hearing election petitions. This may include, as it did during the primary, an order to hold open the polls past 7:00 PM to account for errors made by election officials that prevented people from voting earlier. If so, this also delays the time at which results from that county may be reported to whenever the judge’s order expires. We will continue to get results from counties to which the order does not apply, however. I say all of this because it may delay my ability to make a definitive prediction if certain parts of the state are prohibited from reporting. Fulton contains nearly 20% of the state’s voters, and even minor changes in how the voter’s swing compared to other parts of the state could have an important impact. It is also possible that the result in the rest of the state will be so definitive that Fulton is unlikely to change the outcome.
Understanding the count
Note: this section is very technical, and intended for those with experience in statistics and election modelling.
The Secretary of State’s website has live reporting of the data, but does not provide much analysis due to the principle of impartiality. Most news outlets get their data from a mixture of the the secretary’s official source and the Associated Press’s VoteCast program, which is an army of reporters posted at election offices trying to obtain results before they are posted online. This is why different sources may show different results on election night. I use the secretary’s data only, because access to VoteCast is extremely expensive.
Election data is reported by the Secretary of State by voting precinct and by vote method (Election Day, early in person, absentee by mail, and provisional). Each forms a different “cell” of votes in each precinct. For areas outside the Atlanta metro area, I use counties as the unit of reporting, even though precinct-level data is available. In metro Atlanta, we can’t afford to wait until counties are fully reported. So we instead use precinct-level cells.
| Region | Units | Cells per unit | Total Cells |
| ATL Metro | 833 precincts | 4 | 3,332 |
| Non-Metro | 146 counties | 4 | 584 |
| TOTAL | 979 | 4 | 3,916 |
We differentiate between vote methods because there is often a great deal of difference between how the parties do across different vote methods. We are thus able to project the results across another layer of stratification, making the model more precise than if we lumped all votes together. We wait until all votes in each cell have been recorded. Once we have at least once cell reporting in a region, we can begin measuring the swing from the previous election. We begin by looking at the early trends to see if the swing required by the challenger has been met. If it has, we can begin to start looking for other signs that a change might be happening. If the swing is lower than the required swing, they will have to hope later returns look better for them.
While results in other cells are still being counted, we can project their results using the recorded swing. For example, take election day ballots in a southern county. We use the swing recorded in other southern counties that have fully reported election day ballots, and adjust the previous election’s results by the same swing. That gets us a projected share for the unreported cell.
We can then convert the shares to raw votes. In order to do that, we need a total number of votes. But because the votes aren’t fully counted yet, we have to guess. Technically, we can use the Secretary of State’s Voter Turnout Hub to determine the number of (for example) early votes in each county. Unfortunately, due to blank and invalid votes, and delays in the secretary’s reporting, this isn’t much more accurate than guessing based on the completed cells. We use “vote growth ratios”, which are calculated in each region, segmented by vote method. It is the ratio between the number of votes counted in completed counties/precincts and the number of votes cast in the previous election. Like the regional swing model, it gets more accurate as the night carries on. We then multiply the number of votes in the previous election in the cell by the vote growth ratio, and then multiply that number by each projected share. We have now converted the shares to vote totals.
Now that we have projected vote totals, we can add them to the counted cells across the state. Until we get at least one cell reported in a region/vote method combination, we assume no change (0% swing for all candidates). This is why the projected swing might start very low and grow over time. We completely avoid using swings to project outcomes in other regions or vote methods.
We can usually assume that the swings across various counties in a region will follow a normal distribution. This is proven by results in previous elections. However, we cannot be certain that the first county, or even the second or third to report in a region is a random, unbiased sample. If the first three southern counties to report are Tift, McDuffie and Wayne, we cannot assume that the swing there is similar to the swing in Chatham. Chatham is unlikely to be one of the first to report due to its size. Once we get to four or five counties (or around 10% of the estimated votes) we can tell whether the swing appears to be following a normal distribution, and what the mean is.
One drawback of this method is that we cannot get a simple margin of error, similar to how we do with opinion polling, i.e. we could be wrong by 3% in either direction. I experimented extensively with Markov chains and normal distributions. The problem is the regions; I couldn’t figure out how to get a statewide figure. If there is a way of doing it, it is beyond my statistical knowledge. In my defense, part of the problem is that the true variance depends on the election results. We don’t know how much of a standard deviation there is until enough results are counted, and by then it’s too late. In the words of Supreme Court Justice Potter Stewart, “I know it when I see it.” If at some point, the only way to alter the results is for the unreported areas to report such dramatically different swings as to the rest of the state (say, 5% difference in either direction) as to be statistically improbable, we can say the election is over.
There’s one more catch. We can’t always use precincts to represent swings, because of precinct boundary changes. This is part of why we restrict the usage of precinct-level data to the metro area, where we have no choice. In some counties, such as Forsyth, the precinct boundary changes since the last election are so dramatic that we cannot accurately map the swing in any part of the county. If precinct boundary changes affect anything other than a negligible amount of voters, I combine them into larger “precinct reporting groups” (RPGs). I create them by merging neighboring precincts that “exchanged” voters between elections, such that the swing between elections can be counted with a high degree of precision. This proved to be a monumental task, even for just the 13 counties in the Atlanta metro area. On average, the size of a precinct reporting group is about the size of a rural county in terms of voters, making an ideal unit. Many precincts do not need to be merged in this way. A different sent of PRGs are set up between each pair of elections (2018 and 2026, 2021 and 2026, 2022 and 2026, and so on).
Projected range model
In addition to the regional swing model, we use a projected range model to provide an additional layer of security.
We use the estimated total number of votes calculated using the vote growth ratios and subtract the number of votes actually counted. This gives us the estimated number of remaining votes. We then calculate the minimum and maximum shares of the votes each candidate could receive in the final tally. The minimum share is if all remaining votes were counted for another candidate, and the maximum share is if all remaining votes were counted for the given candidate. This is an obtuse, but fairly definitive way of determining the final outcome. Obviously, there is no way all the remaining votes are going to be cast for the same candidate. But it provides the best possible heuristic for determining whether the election is over.
- If a candidate’s minimum vote share is greater than 50%, they must win.
- If their maximum vote share is less than 50%, they cannot avoid a runoff.
This is closer to the model used by news media to predict when an election is over. It may take a very long time for the projected range model to zero in on a single outcome, but it provides statistical certainty that there is no way result can change.
Write-ins
Write-in votes are not counted on election night. The machines tally write-in votes at the same time they tally other votes, but the list of write-in votes needs to be checked over by election staff before they can be declared valid votes. Only votes cast for declared write-in candidates are legally valid. Write-in votes do not appear on the Secretary of State’s data feed along with the other votes, neither on election night or thereafter. The tallies will instead be published in a separate PDF document after certification weeks later.
No write-in candidate is expected to get more than about 1,000 votes at most. If the final margin of victory in a race is less than about a thousand, AND there is at least one declared write-in candidate, we need to consider the context of the write-in. Otherwise, they are likely irrelevant. Just be aware that write-in votes won’t appear on the Secretary’s website, and won’t appear here until after election day.
See here for a list of write-in candidates.
Provisional ballots
Provisional ballots, like write-in votes, are not counted on election night. In 2022, there were only about 3,000 provisional ballots statewide. That means they have a limited impact on the results. Provisional ballots tend to favor Democrats slightly. The implications are similar to write-ins; they may matter in races with razor-thin margins, but not for the general case.
Provisional ballots compose a fourth of the cells in my regional swing model, but because they consist of so few votes there is a much greater degree of statistical error. I modify the vote growth ratios for provisional ballot cells to ensure at least one vote is projected in each cell to make sure the model doesn’t zero out the number of estimated provisional ballots, giving the misleading impression that there are none.
Congressional and legislative races
For races other than statewide races, we use a modified version of the swing model that doesn’t use regions, called a Uniform Swing Model (USM). This is because the cost-benefit analysis of breaking the races into smaller regions lies in favor of one district-wide swing. The elections are much smaller, the political dynamics much less diverse, and the risk involved in not getting statistically significant results too great. Otherwise, we use principally the same methodology.
In some state legislative races, there is no previous-election benchmark because the previous winner won unopposed. This includes one very important race: House District 154, Gerald Greene’s (R) seat. That race is high on the Democrats’ target list. I am still figuring out what I am going to do for these races.
Source code and implementation
You can see the source code for my models on GitHub. I created them in the form of Jupyter Notebooks written in Python, using data science libraries such as Pandas, NumPy and matplotlib. The source code is licensed to the public under the terms of the GNU Affero General Public License (A-GPL), meaning they are open source and free to use, but if you create derivative works based on them you have to open-source your own work.
For inquiries, feel free to leave a comment below or email me at dawie@dawieboers.com.